
Overview
Here’s a thorough explanation of how to understand the rhythm and tempo graph.
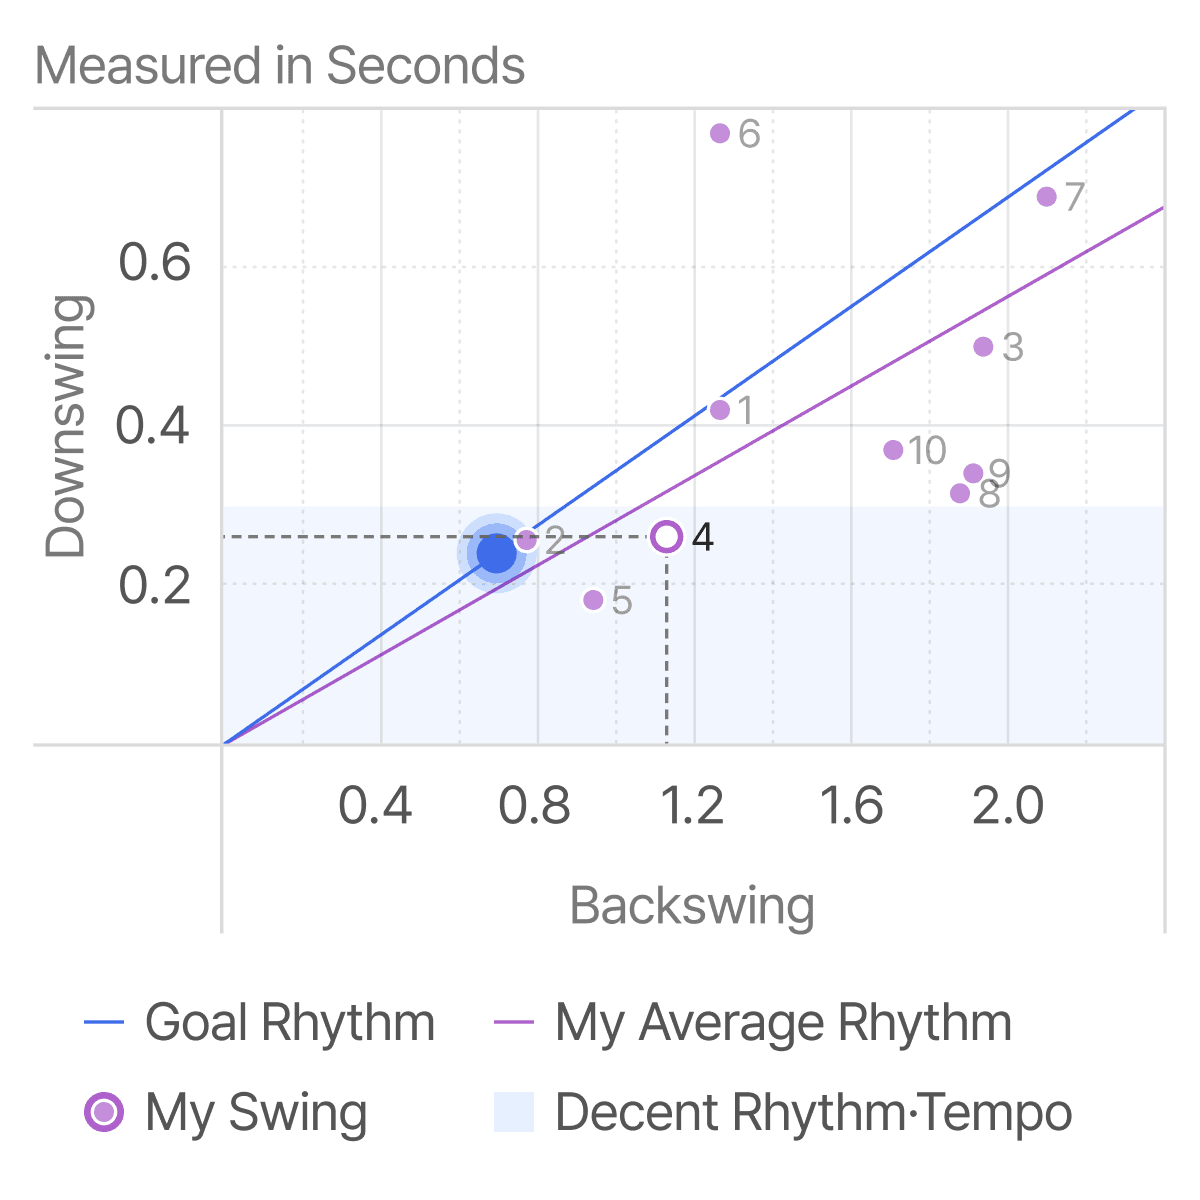
The x-axis of the chart above represents the backswing and the y-axis represents the downswing, all in seconds.
The purple dots() show your swing tempo, and the purple line represents your average rhythm within this drill.
The blue dots() and line represent the target rhythm you’ve set and the recommended tempo
The light blue area() indicates a decent downswing tempo range(within 0.3 seconds) recommended by GolfFix.
We also analyzed how long it takes for pro golfers worldwide to complete their downswing. Professional golfers have downswings between 0.18 and 0.23 seconds. This is really fast considering that even a blink of an eye takes 0.25 seconds. However, we recommend amateurs no more than 0.3 seconds to avoid any injuries.
Use our indicator as a reference to properly determine whether your swing rhythm and tempo are appropriate or not.